PDF in Danish here.
Estimated experiment time ~ 60 min.
Experiment Tips
- Like any other cuvette, the NanoCuvette is sensitive to fingerprints, grease, dust and any other contaminants. Therefore, clean laboratory gloves should be used to handle the cuvettes. The lid should be used as much as possible and the cuvettes should be cleaned before each measurement.
- It is important that the samples be at room temperature when analyzed with NanoCuvette™One. Note: Samples at other temperatures can give unexpected results.
- For best performance, place the nanosensor directly against the light beam. A basic knowledge of the instrument is therefore recommended.
- In this experimental description, seven different types of honey have been used. They vary in color, viscosity, sugar content, water content and other physical parameters. A picture of the honey used is shown in Figure 1.
- When cleaning the NanoCuvette™ One, be sure to dry it well before inserting the new sample. This is to prevent remaining water droplets from diluting the sample more than it already is. To dry the NanoCuvette ™, we suggest using compressed air.
- See the document Cleaning manual on the website for the best possible cleaning procedure.
Expected Results
Note that the data presented is for guidance only. These may vary slightly depending on the type of honey, the instrument used, the room temperature and the sample.
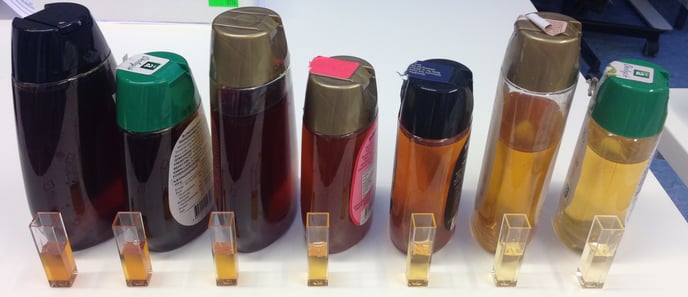
Figure 1 7 different honeys used.
Answers to data analysis questions
- How does the refractive index change with different types of honey?
- The refractive index for honey is close between samples regardless of color. All are over 1.4900.
- How does the absorbance change with different types of honey?
- Figure for calibration curve for absorbance is missing here (find and insert).
Use the following Wedmore equation [1] to calculate the water content of the samples. The value is calculated as a percentage (%). W is the water content and RI is the refractive index obtained.
w (%) = -0.2681 - log(RI - 1)/0.002243.
[1] Giulio Sesta, Lorenzo Lusco. Refractometric determination of water content in royal jelly. Apidologie, Springer Verlag, 2008, 39 (2), pp.225-232. <hal-00892298>.
-
- The water content of the honey samples changes according to origin, production and physical conditions. However, the European regulation requires that the water content of honey be below 20%. You should expect a value in the range of 15-19%.
- Does the calculated water content match your expectations? Justify your answer.
- See the above answer.
- Prove (graphically) the linear relationship between the refractive index and the water content. Explain this relationship in words.
- As already shown in the experiment on “Dilution Series”, the refractive index decreases as the water content increases (dilution of the sample). This can be clearly seen by plotting the water content above the refractive index.
- Is the water content color dependent? Justify your answer.
- The water content is not color dependent and this can be seen by analyzing the data.
- Is the refractive index color dependent? Justify your answer.
- As a water content, refractive index is not color dependent.
- Based on the above questions, describe how NanoCuvette ™ One can be used by the industry to spot honey scams.
- NanoCuvette ™ One can be used to measure refractive index and thus the water content of honey samples. Any sample with a water content of more than 20% can be considered diluted and may indicate fraud.
- Explain how this experiment can be used for quality control of honey.
- Honey samples can be tested by measuring absorbance and refractive index to ensure that they meet the requirements of the European Regulation. If a sample exceeds 20% water content, it must be discarded.
Sample name, honey number Refractive index Water content (%) Temperature (C) honey 1 1.4960 16.2 22.8 honey 2 1.4920 17.8 22.8 honey 3 1.4931 17.4 22.9 honey 4 1.4934 17.4 22.9 honey 5 1.4916 18.2 22.8 honey 6 1.4960 16.2 22.6 honey 7 1.4946 17.0 22.4
Table 1 Refractive index and water content at specified temperature, honey samples.
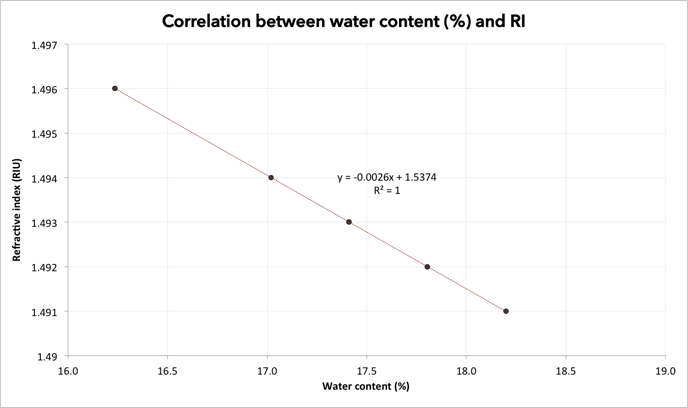
Figure 2 Correlation between water content and refractive index for honey samples. Expected results.
Contact
www.nanocuvette.com