Download Appendix 1
PDF in Danish here.
1. Introduction
Honey is a naturally sweet substance produced by honey bees from the nectar of flowers. The main component of honey is sugar, primarily glucose and fructose. However, honey also contains a wide variety of other substances, including proteins, vitamins, minerals, phenolic compounds, and a small amount of water. In particular, the moisture content of honey is very important for its stability; low moisture content (<20%) protects the honey from antimicrobial activities and allows it to be preserved for longer periods. Unfortunately, the dilution of honey with syrup is a common scam in modern food production. Therefore, good methods for analyzing the amount of water present in honey are of great importance. One such method is the measurement of refractive index.
NanoCuvette™ One is a regular cuvette with an additional optical filter installed on one of the insides. By inserting the cuvette with the filter in the light direction, spectrophotometers can be used to determine the refractive index of a liquid sample. Thus, non-absorbent samples, such as sugar in water, can be quantified using a spectrophotometer.
2. Learning objectives
In this experiment you will:
- Understand the relationship between refractive index and water content in honey samples.
3. Materials
- Spectrophotometer
- NanoCuvette ™ One
- Different honey types (dark and light colors)
- Deionized water (DI water)
- Hot plate
- Vial
- Pipettes
- Stirring stick
4. Safety precautions
This method does not entail any special safety precautions. Please refer to common laboratory practices.
5. Experiment
In this experiment, two dilution series of honey (dark and light) in water are to be made. The goal is to understand how the refractive index (RI) changes in accordance with the water content of honey.
From now on we will refer to the light honey as No 1 and the dark honey as No 2.
- Turn on the spectrophotometer.
- Switch on the heating plate and set it to 40° C.
- Mark 4 vials with:
- Date
- Honey No 1.
- Dilution No: 2x, 4x, 8x, 16x.
- Your names or initials
- Pour 60 mL DI water into a baker and heat it to 40° C.
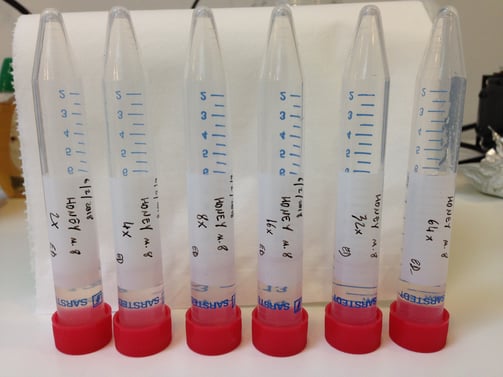
Figure 1. Dilution series of honey No 1. Dilution 2x, 4x, 8x and 16x.
- Add 5 mL of honey No 1 and 5 mL of heated DI water to the 2x vial.
- Mix well and make sure the solution is homogeneous.
- Using the pipette, add 5 mL of heated water to the remaining 3 vials.
- Serially dilute the honey by taking 5 mL from the 2x solution and adding it to the 4x vial, mix well. Take 5 mL from the 4x solution and add it to the 8x vial, mix well. Take 5 mL from the 8x solution and add it to the16x vial, mix well. See pictures of the dilutions, (See Figure 1). Note: You should end up having 5 mL of each solution except the16x, which is 10 mL.
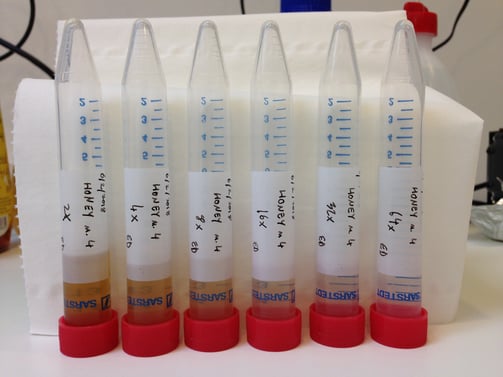
Figure 2. Dilution series of honey number 2. Dilution 2x, 4x, 8x and 16x.
- Prepare a dilution series for honey No 2 by repeating the above procedure (See Figure 1). Note: Make sure to label the vials with honey No 2 this time: Take a NanoCuvette ™ and write down the cuvette number in the specified table (Appendix 1).
- Check the ambient temperature (T) and note it down in the table (See Appendix 1 ). Note: The refractive index is temperature dependent, so it is important to know the actual room temperature at the time of the experiment.
- Open the NanoCuvette software and follow the instructions.
- Measure the NanoCuvette™ in air (empty cuvette).
-
Using a pipette, transfer approx. 3 mL of DI water into NanoCuvette™ and measure both absorbance and refractive index. Note the refractive index value in the table (See Appendix 1). Note: To measure the refractive index, make sure that the filter on the cuvette faces the light beam.
-
Using a pipette, transfer approx. 3 mL of 16x diluted sample into NanoCuvette™. Measure both absorbance and refractive index. Note the refractive index value in the table (See Appendix 1). Note: Be sure to shake the solution before transferring the sample to the cuvette.
-
Discard the sample solution. Clean NanoCuvette™ with soapy water. Leave it with the soapy water for 5 min. Clean with DI water. Dry the cuvette before starting a new measurement.
-
Measure the rest of the samples as described above. Proceed from lowest to highest concentration.
-
Measure honey No 2 using the same procedure (See Figure 2).
Data Analysis
- Calculate the concentration with relative percentage of honey (%). Make sure you use the concentration in percent.
- Make a calibration curve for the absorbance (use peak at 560 nm). Is that what you would expect? Justify your answer.
-
Make a calibration curve for the refractive index. Is that how you would expect it? Justify your answer.
-
Export the data in Excel or other data processing software and create your own calibration chart. Compare it with NanoCuvette™ Software output, do they look the same?
-
What do the graphs show?
-
Can you see a relationship between the refractive index and the dilution of the sample from the data obtained? Justify your answer.
-
Why does the refractive index change with dilution of the sample?
-
Is there a difference in the refractive index of honey No 1 and honey No 2? What is the difference?
-
Explain how this experiment shows the importance of refractive index in water content analysis on honey.
Contact
www.nanocuvette.com