Download pdf here.
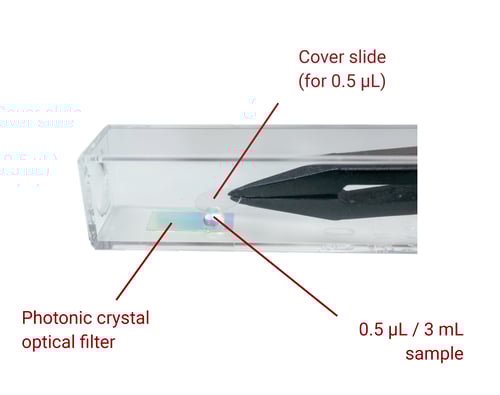
Figure 1. Photograph of low-volume droplet flattened by a coverslip for analysis in a spectrophotometer.
The ability to accurately measure concentrations of low volume samples without any dilution of the original stock is highly desirable for many applications such as DNA, RNA, protein concentrations and fermentation cell count measurements. This saves reagents, prevents dilution errors and gives an estimation of the concentration easily based on a small representative sample volume.
Table 1. List of small volume/micro-volume/nano-volume UV-Vis spectrophotometers [1].
| Model | Brand | Volume | |
| 1 | SpectraMax QuickDrop MicroVolume Spectrophotometer | Molecular Devices LLC | 0.5 µL |
| 2 | QIAxpert Instrument | QIAGEN | 2 µL |
| 3 | BioSpec-nano Micro-volume Spectrophotometer | Shimadzu | 1-2 µL |
| 4 | ScanDrop2 Nano-volume spectrophotometer | Analytik Jena | 0.3 µL-2 mL |
| 5 | DS-11 Spectrophotometer | DeNovix Inc | 0.5-1 µL |
| 6 | NanoDrop™ One Spectrophotometer | Thermo Fischer | 2 µL |
| 7 | Colibri Microvolume Spectrometer | TitertekBerthold | 1-5 µL |
| 8 | Spectrophotometer UV5Nano | MettlerToledo | 1 µL |
| 9 | NanoPhotometer® | Implen | 5 µL |
| 10 | BioDrop µLITE | BioDrop | 0.5 µL |
With advancing technologies, low volume spectrophotometers have emerged. These expensive instruments allow for 0.5 µL to 5 µL measurements in capillary type formats, plate readers or ‘nano’-spectrophotometers. Table 1 provides a list of models capable of measuring low volumes. If both high and low volume regimes are desired, different instrumentation is often required.
In this application article, a method to measure low volume samples around 0.5 µL is described using a conventional spectrophotometer with a high volume 2 mL cuvette holder and the NanoCuvette™ One, see Figure 1. DI water and sucrose solution are used to demonstrate the validity and limitations of this method.
Measurement principle
Direct label-free determination of a sample concentration can be done by measuring the change in the intrinsic property refractive index of the solution. Traditionally, a refractometer has been required for the determination of refractive index. The novel NanoCuvette™ One has a builtin optical filter which enables measurement of refractive index using a conventional
spectrophotometer.
Typically, most analytical refractometers require around 100-300 µL of sample volume to accurately measure refractive index of liquid samples. In Table 2, a list of refractometers is provided.
Table 2. List of small volume/micro-volume and handheld refractometers.
| Model | Brand | Volume | |
| 1 | Abbemat 3X00 Compact Refractometers (Tabletop) [2] | Anton Paar | 200 µL |
| 2 | Model 2010/M (Bulk Material or Thick Film Index/Birefringence Measurement) [3] | Metricon | |
| 3 | Ultra Low Volume Refractometer (Tabletop) [4] | Rudolph Research Analytical | 10 µL |
| 4 | ABBE refractometer AR12 [5] | Schmidt-Haensch | 300 µL |
| 5 | Easy Brix, Easy R40 [6] | Mettler Toledo | 200 µL |
| 6 | Eclipse Professional Optical Refractometers (Hand held Brix) [6] | Bellingham-Stanley | < 1 µL |
| 7 | OPTi Digital Refractometers / Hand-held) [6] | Bellingham-Stanley | |
| 8 | E-line Economy Optical Refractometers [6] | Bellingham-Stanley | |
| 9 | AR200 [7] | Reichert/Ametek | 100 µL |
| 10 | Digital and Analog [8] | ATAGO |
Hand-held portable refractometers are available and used to determine different concentrations of sugar (Brix) with very small sample volume, even below 1 µL in some cases. However, these hand-held instruments are not suited for all applications of refractive index measurements, especially analytical measurements of different concentrations or kinetics of biomolecules like DNA, proteins, RNA etc. where cleanliness, contamination risk, precision, documentation, and data integrity are important.
Using the NanoCuvette™ One and a 10 mm light path spectrophotometer, it is possible to measure low volume samples by dispensing them as droplets with a pipette directly onto the optical filter and subsequently flattening them with a suitable transparent object such as a coverslip, see Figure 1.
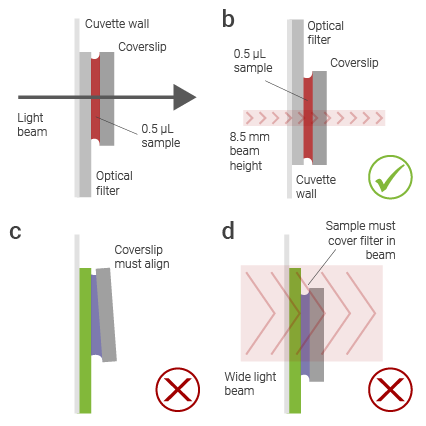 Figure 2. Sketch of correct usage. a) Coverslip position for 15 mm beam height. b) Coverslip position for 8.5 mm beam height. c) Bad alignment of the coverslip. d) Optical filter illuminated by beam and not covered by sample causes shadow signals in the spectrum.
The fundamental principle of flattening a sample droplet with a coverslip ensures that the instrument optics measures the same filter response as with a full 2 mL liquid column in the cuvette. Furthermore, as the droplet is small in volume, surface tension ensures that the flattened droplet and its cover stay in place even for vertical cuvette measurements. Figure 2a and 2b illustrate correct usage for 15 mm and 8.5 mm industry standards of optical beam height in a spectrophotometer, respectively.
Figures 2c and 2d point to the importance of correctly aligning and positioning the sample and coverslip with respect to the optical filter and instrument optics. Modern CCD-array spectrophotometers often have a narrow light beam, which typically fits within the boundaries of
the optical filter and a 6 mm coverslip. However, for conventional scanning instruments the width of the light beam often exceeds these boundaries as sketched in Figure 2c and shadow signal due to air-gap interfaces can appear in the spectrum.
In Figure 3, measurements of the refractive index values for DI water and 5 % sucrose can be seen for narrow beam instrumentation. The calculated RI-values are measured to be 1.333 for DI-water and 1.339 for 5 % sucrose indicating a close match between measurements of the NanoCuvette™ One and a conventional refractometer (Kern Optics ORD 85BM).
The consequences of not adhering to the principles sketched in Figures 2a and 2b can be seen in Figures 4 and 5. For example, performing the droplet measurement without a coverslip results in a droplet curvature and limited sample coverage of the filter in the case of wide beam optics leading to shadow signals appearing in the spectrum, see red circle in Figure 4, and poor model fitting with a low fitting quality of 25 %. In general, the fitting quality metric given in the software should be 80 % or higher.
Sample coverage of the optical filer and aligned surfaces in the optical path improve the spectrum and hence the fitting quality. Compared to not using a coverslip, flattened 10 µL droplet measurements are fitting better to the optical model, see Figure 5. However a shadow signal can still be seen, indicating an air-gap due to droplet curvature which is not captured by the otherwise high fitting quality of 85 % and caution must be taken when interpreting such results. In general, any problems with skewed alignment and position are easier to eliminate for smaller droplets below 1 µL, even for wide beam optics. For 0.5 µL sample droplets, the higher correlation between spectra and fitting model leads to results closer to the 2 mL refractive index measurements, see Figure 6 and Figure 7.
Safety precautions
This method does not entail any safety precautions. Please refer to common laboratory practices. This inexpensive method does not require any new hardware or instrumentation in the form of a low-volume spectrophotometer or a refractometer. The novel NanoCuvette™ One is extending the functionality of existing conventional spectrophotometers and their techniques based directly on the global standard 2 mL cuvette format.
Measurement
Materials and apparatus
Sucrose (Sigma product no. 84100) was used to prepare a sucrose solution with DI water. Glass coverslips of 6 mm in diameter and 0.15 mm in thickness were used to flatten droplets to ensure a uniform curvature. Ocean Optics Red Tide USB-650UV (narrow beam optics), Ocean Optics custom designed Flame S (narrow beam optics) and Shimadzu UV-1800 (wide 6 mm beam optics) were tested.
Sample preparation
For preparation of a 5 % sucrose sample, a solution was produced by dissolving 2.5 g of sucrose (Sigma product no. 84100) in 50 mL of DI water.
Measurement procedure
The spectrophotometer and computer are switched on and the online NanoCuvette™ One software is opened in a web browser. NanoCuvette™ One, is used for the refractive index measurements following the software guidance for each measurement. For each measurement, a droplet of volume 0.5 µL was dispended on the optical filter inside the NanoCuvette™ One both for blank DI water and the sucrose solution, respectively. After dispensing each droplet, a glass coverslip was put on top of the droplet. The coverslip stays in place due to the surface tension of the sample.
References
- https://www.biocompare.com/LabEquipment/22921-Small-VolumeSpectrophotometers/
- https://www.anton-paar.com/corp-en/products/details/abbemat-3x00-compact-refractometers/
- https://www.metricon.com/model-2010-moverview
- https://rudolphresearch.com/low-volumerefractometer/
- https://schmidthaensch.com/products/laboratoryinstruments/refractometer/ar12/?gclid=EAIaIQobChMIjYq-4rCH4wIV1eR3Ch3YewvFEAAYAyAAEgKQAPD_BwE
- https://refractometershop.com/
- https://www.reichertai.com/products/handhelddigital/ar200-automatic-digital-refractometer/
- http://www.atago-usa.com/MASTERSeries-c290/
Updated July 2019 (Software v0.95 and One 2019).