Read about the features of NanoCuvette™ S here.
Software for efficient productivity
The measurement workflows in SpectroWorks™ have been build with user experience in mind and intents to be intuitive and self-explanatory with minimum clutter. This reduces failure modes, while increasing productivity in a clean environment that matches the standards of quality labs.
Entering SpectroWorks™
You can go straight to SpectroWorks™ by entering app.spectroworks.com or find the log-in page on our website or in this Knowledge Base. Once you are in SpectroWorks™, create a project or access an existing one. You will then enter the workspace. In the Create tab, a grid of cuvette types appears. For this workflow select NanoCuvette™ S.
NanoCuvette™ S setup page
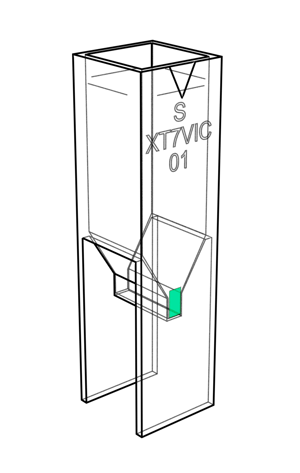
- Identify your cuvette by the box-code and select a cuvette number that matches that of the box. The box code can be found on the box and also on the cuvette itself along with its cuvette number.
- Step 3 shows the particle size and concentration step. Here a fluid material and a particle material has to selected in the material browser by clicking Select, respectively. Each button opens a modal where the desired materials for fluid (particle suspending liquid) and the particle to be size and concentration estimated, are selected.
- Click next. This takes you to the start of the workflow.
TIP #1: The progress and overview of the complete flow can be seen at the top of the workflow view.
TIP #2: Animations at each step illustrates the current cuvette side and whether it is a reference measurement or sample measurement.
NanoCuvette™ S workflow
- Reference measurement (Side A)
- If you have previously uploaded reference spectra, click Choose reference to browse.
- Select a reference liquid or create your own.
- Click the blue box to browse or drag-and-drop a side A reference spectrum onto this area.
- Once the spectrum appears and it is looking good, click next.
- Reference measurement (Side B)
- Click the blue box to browse or drag-and-drop a side B reference spectrum onto this area. Proceed to the next page if it is looking good.
- Reference measurement (Side D)
- Click the blue box to browse or drag-and-drop a side D reference spectrum onto this area. Proceed to the next page if it is looking good.
- Reference fit
- This intermediate step shows how well the reference measurement fits the model. If the fit quality is rated as high, you can proceed to the next page.
- Sample measurement (Sides A, B and D)
- As with the reference spectrum, click the blue box to browse or drag-and-drop in each sample measurement step, the corresponding (A, B or D-side) sample spectrum onto this area. Proceed until sample measurement D, and click next.
- Size distribution fit
- This intermediate step shows how well the sample (A-side) measurement fits the size distribution model. The estimated mean particle diameter and the particle concentration are indicated below the fit quality. Click next, once reviewed.
- Sample fit
- This intermediate step shows how well the sample measurements fits the model. The estimated refractive index is indicated below the fit quality. If the fit quality is rated as high, you can proceed to the final page.
- Scattering fit
- This step shows how well the scattering fits the model. The estimated mean angle and angle std are indicated below the fit quality. Click Finish, once reviewed.
Summary of the measurements
After finishing the workflow, a summary modal appears with details on the experiment setup, selected results and their values, the spectra with options to export the raw data, export plots and even review, which files where uploaded for each step.
For journaling this measurement, details about the sample can be entered in the empty fields and a note can be added for more comments. Everything is continuously saved to the cloud and can always be reviewed by clicking "View" in the View tab for the particular measurement.