Download pdf here.
Proteins - The essentials of life
 A selection of bioassays is available for determining the concentration of purified protein. However, these bioassays require the experimenter to make a standard curve, which, if using the same protein, can be very expensive, and if using a different protein, may induce large systematic errors.
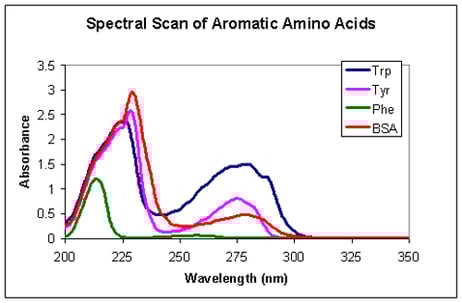
Alternatively, some proteins can be quantified by absorption spectroscopy. A few amino acids (tryptophan, tyrosine and phenylalanine) are aromatic and absorb UV light at 280 nm. Depending on the amount of aromatic amino acids a protein is comprised of, it will absorb more or less light at 280 nm, i.e. have a higher or lower extinction coefficient. The extinction coefficient can be calculated theoretically, but this may give values up to 10 % off. Alternatively it can be determined experimentally. This requires making a standard curve for the specific protein on the specific spectrophotometer.
Absorption spectroscopy
The Beer–Lambert law relates the attenuation of light to the properties of the material through which the light is travelling:
Label-free spectroscopy
Introducing label-free protein measurements
Whereas extinction coefficients of proteins vary greatly, it has been shown that proteins have very similar values of refractive index increment α, i.e. the protein refractive index dependence on protein concentration. Thus the measure of protein refractive index is a quick and easy manner of obtaining the protein concentration without the need of making a standard curve. As a further advantage, this method also allows for direct quantification of your protein without prior dilution.
Standard protein refractive index increment values
- Human 0.1899
- General protein 0.1900
- Membrane proteins 0.1902
- E. coli 0.1902
- Zebrafish 0.1904
- Yeast 0.1907
- C. elegans 0.1911
- Crystallins 0.1930
All that is needed is our NanoCuvette™ One, 0.5 µL sample and an UV-VIS spectrophotometer for instance Shimadzu, PerkinElmer, Thermo Ficher, Mettler Toledo, VWR or similar.
Conclusion
Contact
www.nanocuvette.com