UV-Vis spectrophotometry is a technique used to analyse the absorption of light by a sample at specific wavelengths in the ultraviolet and visible regions of the electromagnetic spectrum.
We can use UV-Vis data to learn about the properties of metal nanoparticles. Useful quantities include absorption (A) ratios at certain wavelengths (λ). It can also be insightful to find the location of peaks and from this, we can calculate estimates of the diameter of the nanoparticles.
The optical and electronic properties of nanoparticles vary with their physical characteristics, like shape and size. Metal nanoparticles have a multitude of uses. In particular, gold nanoparticles have been used in biological and medical applications as drug delivery agents, in electronic conductors, in catalysis, sensors and probes.
The diameter of gold nanoparticles is related to their peak surface plasmon resonance (SPR) wavelength. The SPR of a metal particle is the wavelength of light that results in the free electrons on the surface of the metal to oscillate in resonance with the visible light. Generally, the larger the particle size, the larger the SPR.
The peak surface plasmon value can be extracted using UV-VIS Spectrophotometry. Together with experimental parameters, the average diameter of the nanoparticles particles can be estimated. The following equations have been used in literature [1] to calculate the diameter of gold nanoparticles.
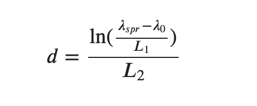
Equation 1: λspr is the peak SPR wavelength and λ0, L1, L2 are experimentally determined parameters.
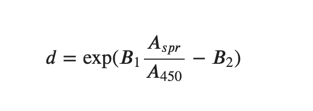
Equation 2: Aspr is the absorbance at the peak SPR, A450 is the absorbance at λ = 450nm and B1, B2 are experimentally determined parameters.
This easy to use interactive Jupyter notebook can analyse hundreds of files of absorbance data in seconds. Currently, we have implemented the following calculations within the notebook:
- Aspr and λspr, the absorbance and wavelength at the peak SPR
- Calculation of any ratios of absorption
- The diameter as given in equation 1 and 2 with adjustable parameters
- Pass/fail tests to confirm whether the data are agreeing with the models defining equation 1 and 2
- The relative width of the peak at 90% of the Aspr value
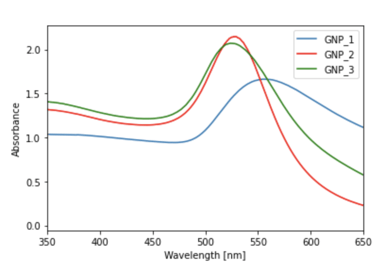
- The ability to plot an adjustable wavelength range and normalise at a given absorbance and the plot of any three overlaying spectra as in figure 1.
- ... and more!