Estimated experiment time ~ 90 min.
PDF in Danish here.
Tips for the experiment
- Like any other cuvette, NanoCuvette™ is sensitive to fingerprints, grease, dust and any other type of contamination. Therefore, clean laboratory gloves should be used to handle the cuvettes. The lid should be used as much as possible and the cuvettes should be cleaned before each measurement.
- It takes some time to prepare the dilution series for the experiment. To mix the solution (honey + hot water), it is usually enough to shake the vial. However, if the honey is too thick, it is easier to stir the solution with a stir bar first.
- The first dilution (2x) can be made semi-qualitatively, as the honey is quite thick. If a graduated cylinder is used, we suggest squeezing honey directly into the vial until it reaches 5 mL.
- It is important that the samples be at room temperature when analyzed with NanoCuvette™. Be sure to allow the samples to cool after the dilution series has been prepared. Note: Samples at other temperatures may give unexpected results.
- To measure the refractive index, it is important that the NanoCuvette™ is positioned correctly in the light direction of the spectrophotometer. For best performance, place the nanosensor directly against the light beam. A basic knowledge of the instrument is therefore recommended.
-
When cleaning the NanoCuvette™, be sure to dry it well before inserting the new sample. This is to prevent residual water droplets from diluting the sample more than it already is. To dry NanoCuvette™ we suggest using compressed air.
-
Go to Cleaning manual on the website for the best possible cleaning procedure.
Expected results
Note that the data presented is for guidance only. These may vary slightly depending on the type of honey, the temperature of the room and the sample, the instrument used and the way the sample has been diluted. The data presented refer to honey numbers 1 and 2. See the tables and graphs below:
|
Sample name, concentration (%) |
Refractive index | Temperature (C) |
| 2x, 50% | 1.4090 | 23.8 |
| 4x, 25% | 1.3699 | 23.8 |
| 8x, 12.5% | 1.3599 | 23.8 |
| 16x, 6.25% | 1.3420 | 23.7 |
| pure water, 0% | 1.3330 | 23.7 |
Table 1: Refractive index at specified temperature, honey No 1
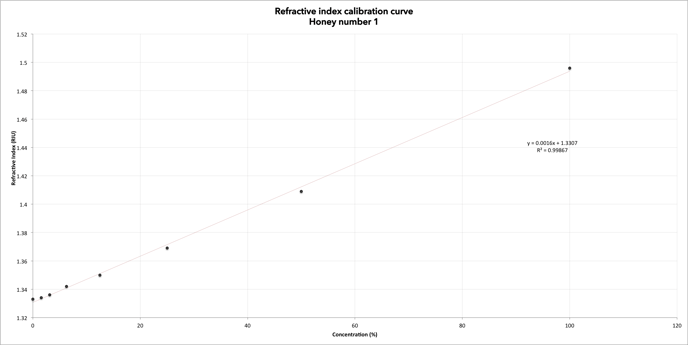
Figure 1: Refractive index calibration curve for honey No 1. Expected results, honey No 1
|
Sample name, concentration (%) |
Refractive index | Temperature (C) |
| 2x, 50% | 1.4213 | 23.6 |
| 4x, 25% | 1.3767 | 23.6 |
| 8x, 12.5% | 1.3525 | 23.6 |
| 16x, 6.25% | 1.3423 | 23.6 |
| pure water, 0% | 1.3330 | 23.6 |
Table 2: Refractive index at specified temperature, honey No 2
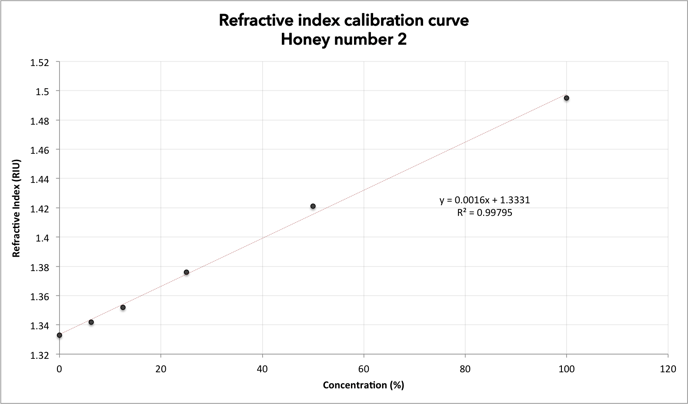
Figure 2: Refractive index calibration curve for honey No 2. Expected results, honey No 2
Answers to data analysis questions
- Calculate the concentration with relative percentage of honey (%). Make sure you use the percentage concentration for the remainder of the data analysis.
- Percentages are 50% (2x), 25% (4x), 12.5% (8x), 6.25% (16x), 0% (pure water)
- Make a calibration curve for the absorbance (use peak at 560 nm). Is that what you would expect? Justify your answer.
- Figure for calibration curve for absorbance is missing (coming soon).
-
Make a calibration curve for the refractive index. Is that how you would expect it? Justify your answer.
-
See the section with expected results.
-
Export the data in Excel or other data processing software and create your own calibration chart. Compare it with NanoCuvette™ Software output, do they look alike?
-
See the section with expected results.
-
-
What do the graphs show?
-
The two graphs show the same result: a linear relationship between refractive index and concentration in the samples. The lower the concentration, the lower the refractive index.
-
-
Can you see a relationship between the refractive index and the dilution of the sample from the data obtained? Justify your answer.
-
The more diluted the sample, the lower the refractive index.
-
-
Why does the refractive index change with dilution of the sample?
-
Diluting the sample, the amount of particles per volume, allows the light to propagate faster through the resolution. The lower the refractive index, the faster the light will propagate (the refractive index of air = 1.0). We find that by diluting the honey, the refractive index becomes lower.
-
-
Is there a difference in the refractive index of honey No 1 and honey No 2? What is the difference?
-
Answers have not been proven yet.
-
-
Explain how this experiment shows the importance of refractive index in water content analysis on honey.
-
Refractive index is an important parameter for the study of honey quality. This experiment shows that by diluting the original sample, the refractive index falls towards the value of pure drinking water (1.3330 at 20 ° C). It is therefore possible to get an idea of the water content by looking at the refractive index value; the lower the value the higher the water content.
-
Contact
www.nanocuvette.com