Updated: 2023-07-12, author(s): CMLBY, EMIHO, ARPDE
Challenge
Particle size analysis (PSA) of nano and microparticles is a
crucial technique used in various fields such as materials
science, pharmaceuticals, biotechnology, and environmental
monitoring. However, today PSA techniques require expensive
instrumentation, which can be a significant barrier to their
widespread adoption. In addition, PSA techniques have limitations
in terms of the size range of particles they can measure
accurately. How to use other instrumentation?
Solution
The NanoCuvette™ S is a low-cost alternative to other PSA
techniques such as Dynamic Light Scattering (DLS) or Laser
Diffraction. Building on traditional UV-Vis spectroscopy and a
standardized protocol, it requires minimal preparation and can
measure particle sizes ranging from 100 nm to 20 μm, making it
suitable for a wide range of particle applications
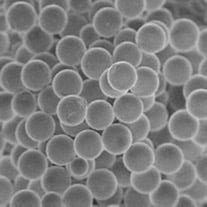
illustrated here with polystyrene latex beads.
1 Introduction
Particle size is a crucial parameter in the characterization of particulate materials and plays a vital role in many industries including food, pharmaceuticals, cosmetics, semiconductors, and more. Accurate measurement of particle size and concentration is directly correlated with the mechanical strength, density, and electrical and thermal properties of finished products in these industries. Poor control of particle size and size distribution can result in significant production losses due to high rejection rates[1].
Particle size and concentration are critical parameters to characterize materials in many industries. Dynamic Light Scattering (DLS) is the current gold standard method for obtaining size distribution of small particles and polymers in liquid samples. However, DLS has inherent limitations when characterizing dilute liquid suspensions containing particles. DLS apparatuses are often expensive and complicated, limiting their mainstream applicability. Furthermore, estimating the refractive index of the fluid sample introduces errors in the obtained size distribution. It is also seen that for samples containing particles of a varying size, DLS may provide imprecise estimates. Finally, DLS is limited to particles smaller than between 1 micrometer and 500 nm depending on the sample.
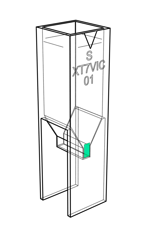
In contrast, the NanoCuvette™ S consumable, see Figure 1 , offers a user-friendly measurement procedure for estimating particle sizes and concentration based on static light scattering at a fraction of the cost compared to DLS measurements. It utilizes existing spectrophotometer instrumentation commonly found in laboratories, see Figure 2. With its unique photonic crystal technology, NanoCuvette™S provides real-time monitoring of particle sizes. As a low-cost alternative it enables efficient and accurate measurement of particle size and concentration, making it an essential tool for industries that require precise particle analysis.
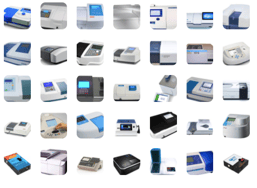 |
| Figure 2: Examples of UV-Vis spectrophotometers. NanoCuvette™ S needs to be inserted inside a spectrophotometer to obtain the A, B and D side spectrum. |
NanoCuvette™ S creates instant value in any laboratory and quality control station. It relies on static light scattering and the existing spectrophotometer instrumentation in laboratories. Therefore, as a DLS instrument is not needed, the measurement can be performed without upfront investment, calibration or training.
2 Method and Instrumentation
As an alternative to inventing a new optical apparatus, the NanoCuvette™ S can be used with conventional spectrophotometers based on an advanced optical analysis available in the online cloud software SpectroWorks™, see Figure 3.
NanoCuvette™ S allows for measurements of absorbance, refractive index and static light scattering of particles for size and concentration determination with a spectrophotometer, see Figure 1.
 |
| Figure 3: NanoCuvette™ S data is analyzed using SpectroWorks™ cloud software at https://spectroworks.com/https://spectroworks.com/. |
The NanoCuvette™ S contains an optical filter inside the cuvette that contains a nano-scale photonic crystal with very high angular resolution. Both the absorption spectrum and the scattering of the sample can be analyzed.
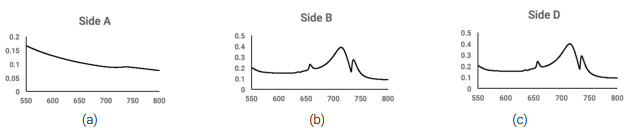
Measurements are recorded with the absorbance side (side A), the photonic crystal (side B), and the opposite side of the photonic crystal (side D) as shown in Figure 4. The results are absorbance, refractive index and an accurate size determination of particles in the nanometer range with known and widely used spectrophotometers together with a cloud-based analysis software, see Figure 3.
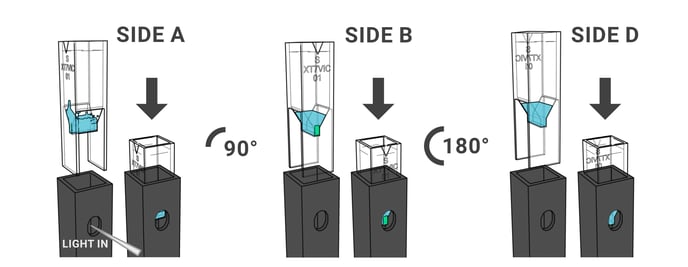 |
| Figure 4: Method for use in a UV-Vis spectrophotometer. Side A, B, and D positions and orientations of NanoCuvette™ S for use with 1 cm path length cuvette-based UV-Vis spectrophotometers. First measure the Side A position by inserting NanoCuvette™ S into the instrument sample cuvette holder such that th optical filter is NOT in the light path (Side A). Then turn the NanoCuvette™ S 90 degrees into the side B position, such that the optical filter is facing towards the light source when illuminated (Side B). Finally, turn the cuvette 180 degrees into the Side D position such that the optical filter is facing towards the detector when illuminated (Side D). Please see our UV-Vis Knowledge Base for more information on the specific orientation of light source and detector for different UV-Vis instrument models. |
3 Theory and Working Principles
NanoCuvette™S is a breakthrough concept that combines accurate and reliable measurements of:- Technology 1: Absorbance.
- Technology 2: Refractive index.
- Technology 3: Concentration and size determination of nano- and microscale objects (particles or biological cells).
3.1 Technology 1: Absorbance via Absorption Spectroscopy

For background, the Beer-Lambert law [2, 3, 4] is a well-known principle used in absorption spectroscopy, which allows for the determination of the concentration of a substance in a solution based on its ability to absorb light at a particular wavelength, see Figure 5.
With absorption spectroscopy, the Beer–Lambert law relates the attenuation of light to the properties of the material through which the light is traveling:![]() where A is the absorbance, ε is the molar extinction coefficient, C is the concentration, l is the path length and A₀ is the background absorbance. The NanoCuvette™ S measures traditional absorbance with the side A spectrum, see Figure 4.
where A is the absorbance, ε is the molar extinction coefficient, C is the concentration, l is the path length and A₀ is the background absorbance. The NanoCuvette™ S measures traditional absorbance with the side A spectrum, see Figure 4.
3.2 Technology 2: Refractive Index via Labelfree Spectroscopy
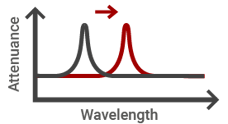
In label-free spectroscopy, light is used to quantify the sample in question. NanoCuvette™ S uses a new type of optical filter (optical chip or photonic crystal) which is inserted into the light beam and the spectrophotometer measures the refractive index by measuring a wavelength color shift on the x-axis at fixed intensity that is proportional to the concentration or sample change in the NanoCuvette™S, similar to Hands law for proteins [5].
When light interacts with the photonic crystal, it creates a resonance at a specific wavelength that is related to the refractive index or concentration of the material near the crystal’s surface. In the simplest linear model, the resonance wavelength, λR, can be described using the equation: ![]() where λ₀ is a reference wavelength, β is a coefficient, and nD is the refractive index of the sample. By measuring the resonance wavelength, the refractive index can be determined. A comprehensive computational model for calculating refractive index based on UV-Vis spectra is built into SpectroWorks™. The NanoCuvette™ S measures refractive index with the side B spectrum, see Figure 4.
where λ₀ is a reference wavelength, β is a coefficient, and nD is the refractive index of the sample. By measuring the resonance wavelength, the refractive index can be determined. A comprehensive computational model for calculating refractive index based on UV-Vis spectra is built into SpectroWorks™. The NanoCuvette™ S measures refractive index with the side B spectrum, see Figure 4.
3.3 Technology 3: Particle Size via Static Light Scattering quantification
Absorption and light scattering are the two major physical processes that contribute to the visible appearance of most objects. A spectrophotometer measures the combination, known as attenuation, of absorption and scattering, but it cannot distinguish between them. Figure 6 is a schematic representation for the classification of absorption and scattering media.

The optical filter inside the NanoCuvette™S consists of a nano-scale photonic crystal capable of measuring very high angular resolution. The absorbance spectrum and the scattering of a dilute sample can be analyzed, and particle size and concentration can be determined with an advanced optical model available on the online cloud software SpectroWorks™. The NanoCuvette™ S measures particle and cell size by combining information from the side A spectrum, the side B spectrum and the side D spectrum, see Figure 4.
Different instruments use different scattering information in different ways to calculate the particle sizes from samples. Below is a comparison to pinpoint the characteristic feature of how NanoCuvette™ S measures particle sizes:
- Dynamic Light Scattering (DLS) conventionally measures scattering over time at a given wavelength.
- Multi Angle Dynamic Light Scattering (MA-DLS) conventionally measures scattering over time at a given wavelength for different angles.
- Static Light Scattering (SLS) with NanoCuvette™ S measures scattering at different wavelengths in different angles at a given time.
Light scattering can be caused by particles and molecules in the sample and its characteristics relate to their size.
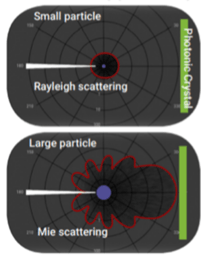
In general, there are three types of light scattering from particles namely 1) Raleigh scattering when particles are smaller than the wavelength of light often characterized by DLS, 2) Mie scattering when the particle size is comparable to the size of the wavelength of light often characterized by laser diffraction and 3) geometric scattering when the particles are much larger relative to the wavelength of light often characterized using a lens or prism.
In general, the NanoCuvette™ S particle analysis method is capable of analysing Raleigh and Mie light scattering, but not geometric scattering, see Figure 7.
4 Measurements, Materials and Experimental Methods
This section describes the measurements, materials and methods related to the use of NanoCuvette™ S. Please note the following:
- Deionized (DI) water and liquid sample should be measured in the same cuvette.
- In case one would like to perform the next sample measurement using the same cuvette, we recommend a wash step (see our recommended wash protocol on our website).
- For very sensitive applications, it is recommended to use a new cuvette with respective reference measurement for each sample measurement.
4.1 Materials and apparatus
- Latex beads, polystyrene 100 nm Product no. LB1-1ML stock from Merck.
- Latex beads, polystyrene 460 nm Product no. LB5-1ML stock from Merck.
- Latex beads, polystyrene 600 nm Product no. LB6-1ML stock from Merck.
- Latex beads, polystyrene 800 nm Product no. LB8-1ML stock from Merck.
- Latex beads, polystyrene 1100 nm Product no. LB11-1ML stock from Merck.
- Latex beads, polystyrene 3000 nm Product no. LB30-1ML stock from Merck.
- UV-Vis spectrophotometer instrument with a given light beam height. Note that UV-Vis spectrophotometers may have different light beam heights.
- NanoCuvette™ S was used.
4.2 Safety Precautions
- Please refer to common laboratory practices.
- This method does not require any additional safety precautions.
- The NanoCuvette™ S is made of PMMA plastic and can disposed of as plastic waste.
4.3 Instrument preparation
- Start spectrophotometer, warm up for 30 min.
- Perform Auto zero (without cuvette).
- Perform System baseline (without cuvette).
4.4 Reference measurement
- Take NanoCuvette™ S.
- Add 300 μL DI water.
- Make sure there are no air bubbles.
- Note the 6 character box number, and the cuvette number.
- Measure side A of the DI Water.
- Measure side B of the DI Water.
- Measure side D of the DI Water.
- Empty the cuvette.
See Figure 4 for the different orientations of the NanoCuvette™ S.
4.5 Sample preparation
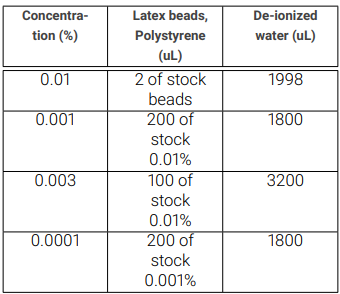
Mix the stock of Latex beads, polystyrene on a vortex mixer. Make a stock solution of each nm size as:
- Pipet 1998 μL of DI Water.
- Add 2 μL of mixed Latex beads, polystyrene.
- Mix until the solution is fully dissolved.
This stock solution has a concentration of 0.01%. From this stock solution of concentration, make the following concentration for the assay in deionized water, see Table 1. Mix the solutions between dilutions.
4.6 Sample A, B and D side measurements
See Figure 4 for the different orientations of the NanoCuvette™ S. Continue using the same NanoCuvette™ S which was used for reference measurements.
- Add 300 μL of the diluted sample.
- Make sure there are no air bubbles.
- Measure A side of sample. (Measure without the photonic crystal towards the light path).
- Measure B side of sample. (Turn the cuvette 90 degrees to the light path and measure through the photonic crystal).
- Measure D side of sample. (Turn the cuvette 180 degrees away from the light path and measure from behind the photonic crystal).
4.6.1 Data Analysis
- Log into https://spectroworks.com/ (online software included in purchase).
- Create a login and password.
Create a project, while selecting to show the following results:
- “Mean Particle diameter”
- “Protein Concentration”
- “Sample angle of incidence”
- “Sample mean angle of incidence”
- “Scattering fit quality”
- “Size distribution fit quality”
- “Sample fit quality”
- “Reference fit quality”
Add all these results for NanoCuvette™ S to the project and they will appear in the final selected results. Then perform the following steps:
- As a project is created, it will lead to “Get started with full spectrum analysis”.
- Select the NanoCuvette™ S functionality.
- Enter the six character box code found on the back of the NanoCuvette™ S packaging and select the cuvette number.
- Select water as fluid material, H₂O (Optical parameter for solvent) and accept.
- Select Particle material, Polystyrene and accept. Click “NEXT”.
- Upload or drag & drop the A-side spectrum from DI water onto SpectroWorks™.
- Upload or drag & drop the B-side spectrum from DI water onto SpectroWorks™.
- Upload or drag & drop the D-side spectrum from DI water onto SpectroWorks™.
- The software will analyze reference data and load results for ”Reference fit”. Click ”NEXT”.
- Upload or drag & drop the A-side spectrum from sample onto SpectroWorks™.
- Upload or drag & drop the B-side spectrum from sample onto SpectroWorks™.
- Upload or drag & drop the D-side spectrum from sample onto SpectroWorks™. Click ”NEXT”.
- Now the SpectroWorks™ software will analyze the recorded spectra for NanoCuvette™ S and calculate the selected results. Click ”NEXT”, then ”NEXT” and finally ”Finish”.
- Finally, the SpectroWorks™ software will show the summary report including all selected results based on the measurements. In addition, it is possible to add all information about the measurements in the ”Sample attributes” and the spectra can be found under ”Plots”.
5 Results
The results section presents the validated data obtained from the measurements using NanoCuvette™ S and the analysis performed with SpectroWorks™ software by an external GLP certified laboratory [6].
The NanoCuvette™ S used with a spectrophotometer requires measurements in three specific orientations explained in Figure 4. The input to the online cloud software, SpectroWorks™, see Figure 3, includes spectra from the A-side, B-side, and D-side of both the reference (water for most samples) and the sample.
5.1 Water Reference Spectrum Analysis
Example reference spectra from DI water are given in Figure 8a, Figure 8b, and Figure 8c. In the case of water, the A-side spectrum shows a flat spectrum because it only interacts with water, which does not absorb light in the visible range. However, the B-side spectrum captures a resonant spectrum of light through the photonic crystal, which is composed of periodic nanostructures that interact with light in specific ways. Here, resonant peaks can be seen between 750-700 nm (TE mode - transverse-electric) and 650-700 nm (TM mode - transverse-magnetic). These are expected due to the interaction with the photonic crystal. Finally, in this case of the D-side spectrum, it is identical to the B-side spectrum for water as there are no particles present in the reference measurements
5.2 Polystyrene Particle Spectrum Analysis
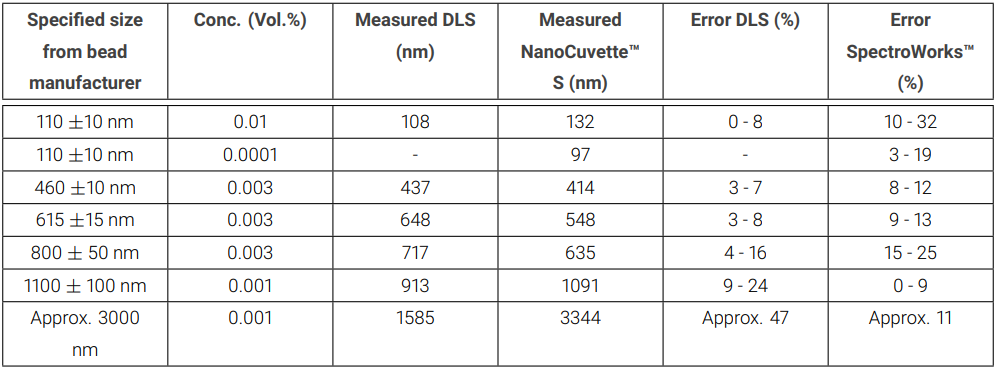
For samples containing particles, the B-side and D-side spectra will be different due to scattering of light detected near and far from the photonic crystal, respectively, in the sample particles. By using the three different orientation measurements with reference and sample, SpectroWorks™ can analyze particles. Validation of the technology ranging in size from 100 nm to 3000 nm in dilutions between 0.01% - 0.0001% was done by an external company, Particle Analytical ApS, in [6] who is a GMP certified contract laboratory, and resulted in data comparisons and graphs, which are presented in Table 2 and Figure 9.
5.3 Particle Size Analysis
Table 2 and Figure 9 presents a comparison between NanoCuvette™ S based on SLS and the gold standard DLS method for the measured particle sizes. As mentioned earlier, Particle size analysis (PSA) techniques often have limitations in terms of the size range of particles they can measure accurately, and it is known that DLS is often limited to particles smaller than between 500 nm and 1000 nm depending on the sample.
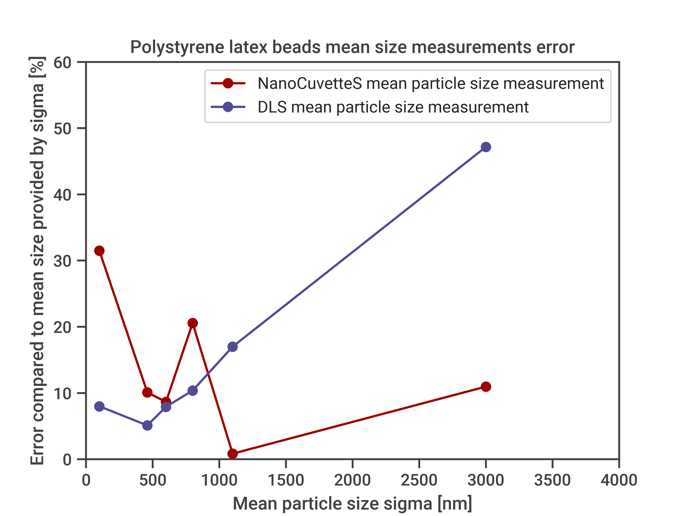
In the case of the polystyrene bead particles measured here, it can be seen that as the particle diameter increases beyond 500 nm, the DLS method becomes less and less accurate with errors up to approximately 47% whereas the SLS method with NanoCuvette™ S delivers useful results for a wide range of nanometer to micrometer scale particle sizes, see Figure 10. In addition, the method also provides information about the particle concentration, see Figure 11.
The results from [6] demonstrate the accuracy and reliability of the NanoCuvette™ S SLS technology in determining particle sizes values across a wide range of sizes and dilutions. The strong correlation between the measured and known values, along with the consistency in the measurements, supports the suitability of this technique for various applications in industry and research.
 |
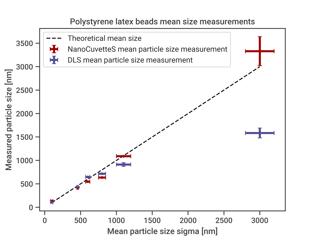 |
| Figure 9: Particle size comparison between DLS and NanoCuvette™ S / SpectroWorks™ validation analysis. Data from [6]. |
 |
|
Figure 10: Error on particle size comparison between DLS and NanoCuvette™ S / SpectroWorks™ validation analysis. Note the systemic nature of the DLS error progression. Data from [6]. |
 |
|
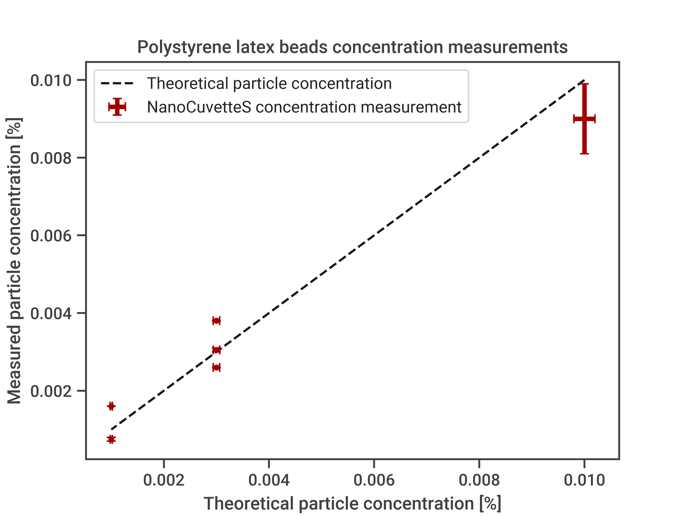
Figure 11: Particle concentration with NanoCuvette™ S / SpectroWorks™ validation analysis. The results do not take into account any dilution errors. Data from [6].
|
6 Discussion
The PSA results from [6] and provided above illustrate the use of NanoCuvette™ S technology in conjunction with UV-Vis spectrophotometers and SpectroWorks™ software as a reliable and accurate method for measuring the particle size of polystyrene latex beads. This method overcomes several limitations associated with traditional PSA techniques (like DLS or Laser Diffraction), such as expensive instrumentation, sensitivity to air bubbles, particles or other impurities, limited measurement range, and the need for frequent calibration. By utilizing existing spectrophotometric instrumentation and cloud-based software, this method allows for efficient and precise analysis without significant upfront investments or extensive training.
The light scattering behavior of particles is directly influenced by their size. The size and instrumentation of detectors used in spectrophotometers from different brands can also vary resulting in different amounts of recorded scattering for different particle sizes and concentrations. Thus, to achieve the most accurate particle estimation with a given instrument, there is an optimal concentration range that must be considered.
The results presented in Table 2 were obtained using the VWR UV6300-PC scanning spectrophotometer with a maximum absorbance of 3 A. However, different scanning instruments may have varying internal structures that can influence particle size estimation in SpectroWorks™. Therefore, users may need to optimize their approach based on the respective particle size and the specific instrument being used.
The standard curve of the Latex polystyrene bead particles was obtained by measuring a series of different sizes and dilutions with the NanoCuvette™ S and analyzing the data using SpectroWorks™ software. The resulting particle sizes were determined and are presented in Table 2. Figure 9 shows a graphical comparison of the measured particle size values and the known specified size from the manufacturer, demonstrating a strong correlation between the two.
7 Conclusion
In conclusion, NanoCuvette™ S presents a promising low-cost alternative for accurately and reliably measuring particle sizes of polystyrene latex beads in solutions. With its use of existing spectrophotometer instrumentation and cloud-based software, the PSA method provides a cost effective and user-friendly solution that does not require extensive training or significant upfront investments.
The ability of the SLS technology to overcome the limitations of traditional instrumentation like DLS, both in sensitivity to impurities and the need for frequent calibration, makes it a valuable tool for a wide range of industries, including food and beverage manufacturing and research. Additionally, the method can be adapted to measure other parameters, such as protein concentration, with minor adjustments to the software parameters.
Overall, the NanoCuvette™ S technology offers a powerful and versatile solution for accurate particle size measurements in various applications. The wide particle size range and insensitivity to impurities make this technology particularly beneficial for quality control, research and development purposes across various industries. The NanoCuvette™ S technology is particularly advantageous for particle and powder producers, researchers, and students who require a robust and accurate method to determine particle size in solutions.
References
[1] J. Stetefeld, S. A. McKenna, and T. R. Patel. Dynamic light scattering: a practical guide and applications in biomedical sciences. Biophysical Reviews, 8(4):409–427, 2016. 1
[2] Pierre Bouguer. Essai d’optique sur la gradation de la lumière. Claude Jombert, page 16–22, 1729. 3.1
[3] J.H. Lambert. Photometria sive de mensura et gradibus luminis, colorum et umbrae. 1760. 3.1
[4] Beer. Bestimmung der absorption des rothen lichts in farbigen flüssigkeiten. Annalen der Physik und Chemie, 162(5):78–88, 1760. 3.1
[5] David B. Hand. The refractivity of protein solutions. The Journal of Biological Chemistry, 108(3), 1935. 3.2
[6] Søren Lund Kristensen Wenbo Wang. Testing and validation of nanocuvette™ s, spectroworks™ together with uv-vis spectrophotometer. Validation report, Particle Analytical ApS, 2021. 5, 5.2, 5.3, 6
FOR RESEARCH USE ONLY.
NOT FOR DIAGNOSTICS.
-