1. UV-Vis Knowledge Base
  2. UV-Vis Analysis Solutions
  3. Quality control and production applications

Quality control report template for absorbance, particle size and concentration of Titanium Dioxide based on UV-Vis Spectral Data from SpectroWorks™

This Jupyter-notebook plots spectra from SpectroWorks™ and calculates the absorbance in a given range. It also calculates the particle size and concentration of samples of Titanium Dioxide.

 
Challenge: We wish to analyse large quantities of titanium dioxide to ensure the samples are within desired ranges of absorbance, particle size and concentration.
Solution: This intuitive easy-to-use Jupyter notebook can process hundreds of samples of titanium dioxide in seconds and return pass/fail results for the desired values of absorbance, particle size and concentrations.

Titanium dioxide is has a variety of uses in both industry and research. It is a white, insoluble solid and is particularly useful as a pigment in both paints, food colourings, cosmetics and sunscreen. Its use as a pigment is largely due to its brightness and high refractive index, it is used in two-thirds of all pigments worldwide.
For use in sunscreens, titanium dioxide nanoparticles are used. They are not absorbed into your skin and the bright surface reflects incoming sun, allowing for protection against UVB and UVA rays. With sufficiently small particle sizes, there is minimal white appearance on the skin. However, if the size of the particles becomes too small, the effectiveness against UVA rays is decreased.
This easy to use interactive Jupyter notebook allows for the quick analysis of important characteristics of titanium dioxide: its absorbance, concentration, and particle size.
The following is an example of the usage of the notebook using one sample of titanium dioxide. The Jupyter notebook is designed to support the quality control analysis of many samples simultaneously.

Test A: Absorbance of TiO2
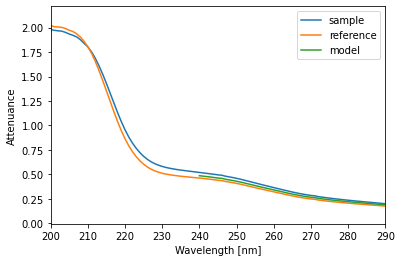
 

spectral_data
 
Figure 1: A spectrum for a sample of Titanium Dioxide as calculated using the NanoCuvette S™ and the SpectroWorks™ software.
 
Description: Calculate the absorption within a given wavelength and test if it is above a minimum absorption.
Parameters: Enter your wavelength bounds in nanometers and the minimum absorption in order for the sample to pass.
 
Minimum Wavelength (nm) Maximum Wavelength (nm)  Minimum Absorption
240 300  10


Result: The absorption is calculated and a Pass / Fail result is produced.

Calculated Absorption  Pass / Fail
11.139 PASS

Test B: Particle Size of TiO2 


particle_size_dist

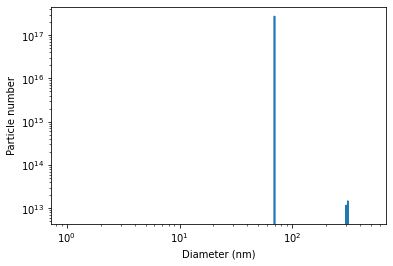
Figure 2: A graph showing the distribution of particle number and particle diameter as calculated using the NanoCuvette S™ and the SpectroWorks™ software.


Description: Calculate the diameter of the particle in nm IF enough particles found within bounds of size, otherwise give NaN.

Parameters: Enter the expected diameter of TiO2 and the tolerance in nanometers.


Diameter (nm)   Diameter tolerance (nm)
60  ± 25


Result: The diameter of the particles are calculated and a Pass / Fail result is produced.

Diameter of TiO2 (nm)  Pass / Fail
51.982 PASS

Test C: Percentage of particles of TiO2 with given size

Description: Calculate the number of particles within the desired diameter range (set above) as a percentage of total particles and test if above a minimum percentage.

Parameters: Enter the minimum percentage of particle concentration within size bounds relative to the total concentration (%).


Particles within size bound (%)  95
 

Result: The number of particles as a percentage of total particles are calculated and a Pass / Fail result is produced.

Are there at least 95% of total particles within the diameter range 35 < < 85 nm? Pass / Fail
PASS


Test D: Concentration of TiO2

Description: Calculate the total concentration of TiO2 in the sample and test if it is within the bounds of desired concentration.

Parameters: Enter the total volume in cm3 for the sample:

Sample Volume (cm3) 1000
TiO2 mass in sample (g) 20
Density of TiO2 in sample (g/cm3) 3.78
Dilution factor 100
Concentration tolerance percentage (%) 20
 

Result: The total concentration is calculated and a Pass / Fail result is produced.

Total Concentration of TiO2 in sample (g/l) Pass / Fail
0.339 FAIL


SpectroWorks™ for UV-Vis spectra and NanoCuvette™ analysis comes with API access. Whether you're a student, a scientist or a technician, Colab notebooks and SpectroWorks™ can make your work around UV-Vis spectrophotometers easier and faster. 
 

Contact us for more information 

Copenhagen Nanosystems ApS (cphnano),
Hørmarken 2, DK-3520 Farum, Denmark
Tel: +45 36 99 27 46