Updated: 2023-08-11, author(s): CMLBY, EMIHO, ARPDE
Challenge
Refractometers are a useful tool for measuring the sugar content of a solution using the °Brix index. However, their accuracy can be affected by the presence of air bubbles, particles, or other impurities in the sample. Refractometers typically also have a limited range, which may not be suitable for high sugar concentrations or samples containing other dissolved solids. Frequent calibration is also often required, which can be time-consuming. How to use other instrumentation?
Solution
NanoCuvette™ One uses existing spectrophotometers and the SpectroWorks™ software to accurately measure refractive index, °Brix index and sucrose concentrations. Results are not affected by impurities, have a wide refractive index range, and do not require calibration for precise measurements.
1 Introduction
 Sugar is a popular ingredient in various food and beverage products. The term "sugar" refers to sweet, soluble carbohydrates, including monosaccharides like glucose and fructose. Sucrose is the chemical name for the disaccharide made up of one glucose and one fructose unit. Different types of sugars can be extracted from the tissue of most plants and used commercially.
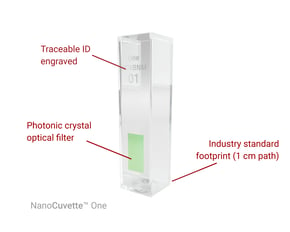 |
| Figure 1: The consumable NanoCuvette™ One required to complete measurements in a spectrophotometer together with analysis in the software SpectroWorks™. |
The measurement of refractive index is a well-established method for determining the sugar content in solutions. Therefore, refractometry is a widely used method in the sugar industry for quickly measuring the sugar content in solutions. For solutions containing a single, known compound, the refractive index measurement is a precise means of determining the concentration of that specific sugar. In the case of mixed solutions with a high sugar content, however, the refractive index measurement can only provide an approximate estimate of the sugar content due to the presence of interfering factors such as other dissolved substances or impurities. Nonetheless, refractive index remains a valuable tool for analyzing sugar content in various applications.
 |
Traditionally, refractometers have been used as the tool to measure the sugar content of a solution using the °Brix index. However, their accuracy can be affected by the presence of air bubbles, particles, or other impurities in the sample. Refractometers typically also have a limited range of measurement, which may not be suitable for high sugar concentrations or samples containing other dissolved solids. Finally, frequent calibration is also often required, which can be both difficult and time-consuming. Due to these practical shortcomings, different alternatives have been developed, including NanoCuvette™ One for use in a cuvette-based UV-Vis spectrophotometer.
 |
| Figure 3: NanoCuvette™ One data is analyzed using SpectroWorks™ cloud software at https://spectroworks.com/. |
As an alternative, NanoCuvette™ One is a novel technique that offers a user-friendly procedure
for refractive index measurements. As a feature, NanoCuvette™ One utilizes existing spectro-photometers and the SpectroWorks™ software to accurately measure refractive index, °Brix index and sucrose concentrations.
With NanoCuvette™ One, the benefits include that results are not affected by impurities, have a wide refractive index range, and do not require calibration for precise measurements.
NanoCuvette™ One creates instant value in any laboratory and quality control station. It relies on the existing spectrophotometer instrumentation in laboratories. Therefore, as a refractometer instrument is not needed, the measurement can be performed without upfront investment, calibration or training.
2 Method and Instrumentation
Instead of re-inventing a new optical apparatus, our technology NanoCuvette™ One is a novel cuvette containing samples for widely used spectrophotometric experiments and with an advanced optical analysis available in the online cloud software SpectroWorks™, see Figure 3. Our core technology introduces a disruptive design, allowing spectrophotometer users to measure both the absorbance and refractive index, see Figure 1.
Our cuvettes include a surface with a photonic crystal which enables refractive index measurements in a spectrophotometer for the first time, see Figure 5, together with a cloud-based analysis software, see Figure 3.
3 Theory and Working Principle
NanoCuvette™ One is a breakthrough technology that enables accurate and reliable measurements of refractive index using spectrophotometry and label-free spectroscopy. Its advanced optical filter, comprised of nano-scale photonic crystals, allows for precise analysis of the attenuance output spectrum. With an advanced optical model available through the cloud-based software SpectroWorks™, refractive index and concentration can be determined with confidence.
3.1 Absorbance via Absorption Spectroscopy
For background, the Beer-Lambert law is a well-known principle used in absorption spectroscopy, which allows for the determination of the concentration of a substance in a solution based on its ability to absorb light at a particular wavelength, see Figure 4.
With absorption spectroscopy, the Beer–Lambert law relates the attenuation of light to the properties of the material through which the light is traveling:![]() where A is the absorbance, ε is molar extinction coefficient, C is the concentration, l is the path length and A₀ is the background absorbance.
where A is the absorbance, ε is molar extinction coefficient, C is the concentration, l is the path length and A₀ is the background absorbance.
3.2 Refractive Index via Label-free Spectroscopy
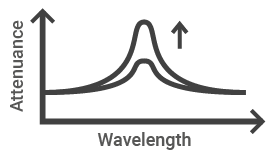
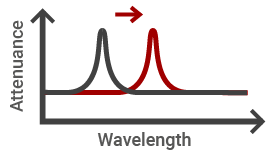
In label-free spectroscopy, light is used to study the properties of nanoscale photonic crystals. With NanoCuvette™ One the software uses a new type of optical filter (optical chip or photonic crystal) which is inserted into the light beam and the spectrophotometer measures the refractive index by measuring a wavelength color shift on the x-axis at fixed intensity that is proportional to the concentration or sample change in the NanoCuvette™ One, similar to David B. Hand's law for proteins [1]. When light interacts with the photonic crystal, it creates a resonance at a specific wavelength that is related to the refractive index or concentration of the material near the crystal’s surface. In the simplest linear model, the resonance wavelength, λR, can be described using the equation:![]() where λ₀ is a reference wavelength, β is a coefficient, and nD is the refractive index of the sample. By measuring the resonance wavelength, the refractive index can be determined. A comprehensive computational model for calculating refractive index based on UV-Vis spectra is built into SpectroWorks™.
where λ₀ is a reference wavelength, β is a coefficient, and nD is the refractive index of the sample. By measuring the resonance wavelength, the refractive index can be determined. A comprehensive computational model for calculating refractive index based on UV-Vis spectra is built into SpectroWorks™.
3.3 The °Brix scale
°Brix is a unit of measurement used to express the sugar content of a liquid solution, typically in the context of the food and beverage industry. It is named after the Austrian scientist Adolf Brix, who developed the °Brix scale. The °Brix value is determined by measuring the refractive index of a solution and can be used to estimate the sugar content in a variety of liquids, such as fruit juices, wine, and honey. The refractive index is a measure of how much a substance bends light, which is related to its concentration and composition. The °Brix scale correlates the refractive index of a solution with the percentage of sucrose by weight. For example, a °Brix value of 10 indicates that the solution contains 10% sucrose by weight. °Brix is primarily used in fruit juice, wine making, carbonated beverage industry, starch and the sugar industry.
Dissolution of sucrose and other sugars in water changes not only its specific gravity but also its optical properties, in particular its refractive index and the extent to which it rotates the plane of linearly polarized light. The refractive index, nD, for sucrose solutions of various percentages by mass has been measured and published. When refractive index is used, the °Brix value can be obtained from the polynomial fit to the ICUMSA table [2]:
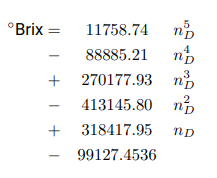
where nD is the refractive index measured at the wavelength of the sodium D line (589.3 nm) at 20 °C. Temperature is often important and specified for a particular measurement as refractive index changes with temperature. The above equation for °Brix values is built into SpectroWorks™.
4 Measurements, materials and methods
This section describes the measurements, materials and methods related to the use of NanoCuvette™ One. Please note the following:- Deionized water reference and the sample should be measured in the same cuvette.
- If reusing the same cuvette for additional sample measurements, we recommend a washing and cleaning step (see our recommended wash protocol on our website).
- For high-precision applications, we recommend to use a new cuvette with respective deionized water reference measurements for each sample measurement.
4.1 Materials and apparatus
- Sucrose Product no. S9378-500G stock from Sigma Aldrich.
- Shimadzu-UV1800 double beam spectrophotometer instrument.
- NanoCuvette™ One used for measurements. For this application note 15 mm beam height NanoCuvette™ One was used due to the height 15-20 mm of light beam in a scanning type spectrophotometer (UV1800).
4.2 Safety Precautions
- Please refer to common laboratory practices.
- This method does not require any safety precautions.
- The NanoCuvette™ One is made of PMMA plastic and can be disposed as plastic waste.
4.3 Instrument preparation
- Start spectrophotometer, warm up for 30 min.
- Perform Auto zero (without cuvette).
- Perform System baseline (without cuvette).
Choose the scan method in the spectrophotometer with a wavelength range of 1100 nm - 190 nm (and the specified parameters e.g. Shimadzu-UV1800 ‘slow-scan-mode’ with 2.0 nm wavelength resolution).
4.4 Reference measurement
- Take NanoCuvette™ One from the box.
- Add 3000 μL DI water.
- Make sure there are no air bubbles.
- Capture the box number, cuvette number.
- Measure side B of the DI Water.
- Empty the cuvette, and let it dry.
See Figure 5 for the different orientations of the NanoCuvette™ One.
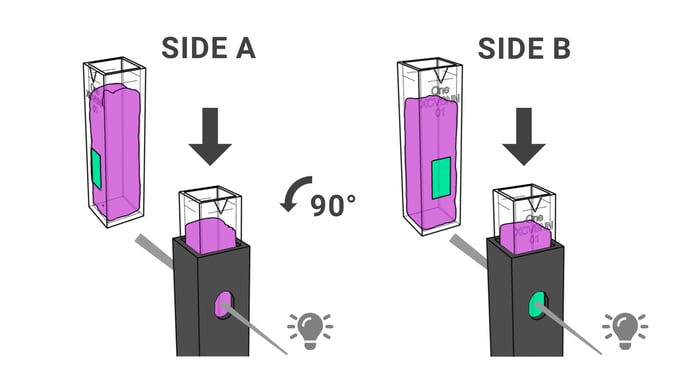 |
| Figure 5: Method for use in a spectrophotometer. Side A/B positions and orientations of NanoCuvette™ One for use with 1 cm path length cuvette-based UV-Vis spectrophotometers. First measure the Side A position by inserting NanoCuvette™ One into the instrument sample cuvette holder such that the optical filter is NOT in the light path (Side A). Then turn the NanoCuvette™ One 90 degrees into the side B position, such that the optical filter is facing towards the light source when illuminated (Side B). Please see our UV-Vis Knowledge Base for more information on the specific orientation of light source and detector for different UV-Vis instrument models. |
4.5 Sample preparation
Pure sucrose is dissolved in deionized water to a concentration corresponding to 50 °Brix.
A stock solution can be prepared as follows:
- Weigh out a quantity of 50 g of pure sucrose.
- Add 50 g of deionized water.
- Mix until the solution is fully dissolved
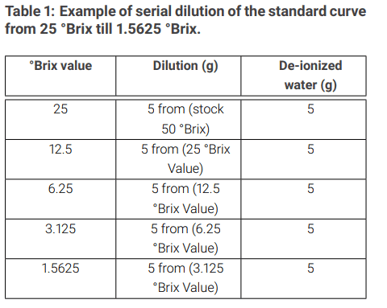
From this stock solution (50°Brix), make a standard curve in a serial dilution from 50 °Brix to 1.5625 °Brix using deionized water, see Table 1. Mix the solutions between dilutions.
4.6 Sample A & B side measurements
See Figure 5 for the different orientations of the
NanoCuvette™ One.
We are continuing in the same NanoCuvette™ One which was used for DI Water reference.
Measure the serial dilution with increasing °Brix value, starting at lowest °Brix concentration 1.5625 °Brix. Wash the cuvette between each sample.
- Add 3000 μL of the diluted sucrose sample.
- Check that no air bubbles are present.
- Measure A side of sample. (Measure without the photonic crystal towards the light path).
- Measure B side of sample. (Turn the cuvette 90 degrees to the light path and measure through the photonic crystal).
4.6.1 Data Analysis
- Log into https://spectroworks.com/ (online software).
- Create your login and password.
- ’Degrees Brix’
- ’Protein Concentration’
- ’Sample fit quality’
- ’Reference fit quality’
- As a project is created, it will lead to ”Get started with full spectrum analysis”.
- Select the NanoCuvette™ One functionality.
- Enter the six character box code found on the back of the NanoCuvette™ One box and select the cuvette number.
- Select fluid material, H2O (Optical parameter for solvent) and accept.
- Click ”NEXT”.
- Upload or drag & drop the B-side spectrum from DI water onto SpectroWorks™.
- The software will analyze reference data and load results for ”Reference fit”. Click ”NEXT”.
- Upload or drag & drop the A-side spectrum from sample onto SpectroWorks™.
- Upload or drag & drop the B-side spectrum from sample onto SpectroWorks™. Click
”NEXT”. - The software will now analyze sample data and load results for ''Sample fit''. Click ''NEXT''.
- The software will now calculate “Degrees Brix” and load results. Click ''NEXT''.
- The software will now calculate the “Protein Concentration” and load results. Click ''Finish''.
- Finally, the software will load summary and load results for ''Summary''. It is possible to add all information about the measurement in the ''Sample attributes''. Under ''Plots'' the spectra can be seen.
5 Results
The results section presents the data obtained from the measurements using NanoCuvette™ One and the analysis performed with SpectroWorks™ software. The data collected from a series of sucrose dilutions demonstrates the ability of the technology to accurately determine the °Brix values and sucrose concentrations.
5.1 Reference and Sample Spectra
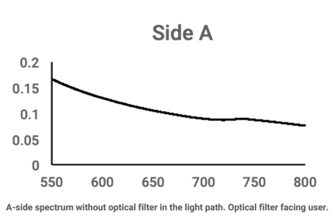
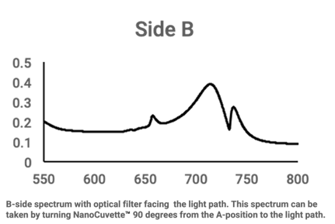
Figure 5 illustrates the two specific orientations of the NanoCuvette™ One when placed inside a spectrophotometer. The input data for the SpectroWorks™ online cloud software includes the Aside and B-side spectra from both the reference (DI water) and the sample measurements. Figures 6a and 6b display the example reference spectra expected from deionized (DI) water.
In the A-side spectrum, light interacts solely with the deionized (DI) water. As there is no absorbance of light in the visible range for deionized (DI) water, the spectrum is flat, as seen in Figure 6a. The B-side spectrum, shown in Figure 6b, captures the resonant spectrum of light passing through the optical filter containing the photonic crystal. The resonant peaks between 750-700 nm (TE mode) and 650-700 nm (TM mode) result from the interaction of light with the photonic crystal and are expected in the analysis.
5.2 Standard Curve and °Brix Analysis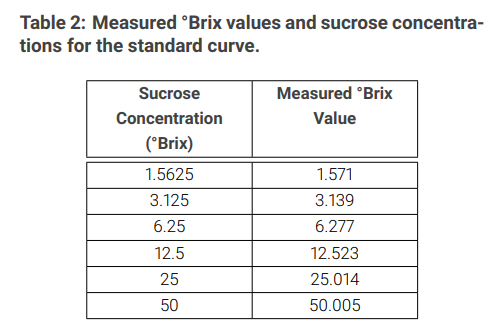
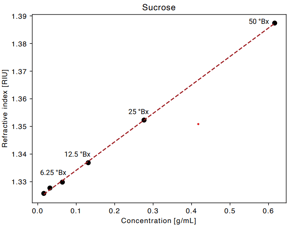
The standard curve of sucrose was obtained by measuring a series of sucrose dilutions with the NanoCuvette™ One and analyzing the data using SpectroWorks™ software. The resulting °Brix values and sucrose concentrations were determined and are presented in Table 2. Figure 7 displays a graphical comparison of the results, demonstrating a strong correlation between the measured °Brix values and the known sucrose concentrations.
The results demonstrate the accuracy and reliability of the NanoCuvette™ One technology in determining °Brix values and sucrose concentrations across a wide range of concentrations. The strong correlation between the measured and known values, along with the consistency in the measurements, supports the suitability of this technique for various applications in food and beverage industries, research, and quality control.
6 Discussion
The results obtained using NanoCuvette™ One and the UV-Vis spectrophotometer, coupled with SpectroWorks™ software, demonstrate a reliable and accurate method for measuring sugar content in terms of °Brix index and sucrose concentration. The NanoCuvette™ One technology overcomes several limitations associated with traditional refractometry, including sensitivity to air bubbles, particles (or other impurities), limited measurement range, and the need for frequent calibration. By utilizing existing spectrophotometer instrumentation and cloud-based software, this method allows for efficient and precise analysis without the need for significant upfront investments or extensive training.
The NanoCuvette™ One technology is particularly advantageous for food and beverage manufacturers, researchers, and students who require a robust and accurate method to determine sugar content in solutions. The wide refractive index range and insensitivity to impurities in the sample make this method suitable for various applications, from quality control in production processes to research and development of new products.
The standard curve of sucrose dilutions, as demonstrated in Table 2 and Figure 7, indicates a strong correlation between the °Brix index and sucrose concentration measurements. This correlation showcases the accuracy and reliability of the NanoCuvette™ One technology in determining sugar content. The method can also be extended to other applications, such as protein concentration measurements, by utilizing the label-free spectroscopy technique and adjusting the SpectroWorks™ software parameters accordingly.
7 Conclusion
In conclusion, NanoCuvette™ One offers a viable alternative to traditional refractometry for measuring sugar content in solutions, specifically through the °Brix index and sucrose concentration measurements. The technology capitalizes on existing spectrophotometer instrumentation and cloud-based software, ensuring accurate and reliable results without significant investments or extensive training. The method is well-suited for food and beverage manufacturers, researchers, and students, and can be extended to other applications, such as protein concentration measurements, with minor adjustments to the software parameters.
By overcoming the limitations of traditional refractometry, such as sensitivity to impurities and the need for frequent calibration, NanoCuvette™ One proves to be a valuable tool for determining sugar content in various applications. The wide refractive index range and insensitivity to impurities make this technology particularly beneficial for quality control and research as well as development purposes across various industries.
References
[1] David B. Hand. The refractivity of protein solutions. The Journal of Biological Chemistry,
108(3), 1935. 3.2
[2] ICUMSA Methods Book. op. cit. edition. Specification and Standard SPS-3 Refractometry and
Tables – Official; Tables A-F. 3.3
FOR RESEARCH USE ONLY.
NOT FOR DIAGNOSTICS.