Estimated experiment time ~ 60 min.
PDF in Danish here.
Tips for the experiment
- Like any other cuvette, NanoCuvette is sensitive to fingerprints, grease, dust and any other type of contamination. Therefore, clean laboratory gloves should be used to handle the cuvettes. The lid should be used as much as possible and the cuvettes should be cleaned before each measurement.
- It is important that the samples are at room temperature when analyzed with NanoCuvette™. Note: Samples at other temperatures may give unexpected results.
- To measure the refractive index, it is important that the NanoCuvette™ is positioned correctly in the light direction of the spectrophotometer. For best performance, place the nanosensor directly against the light beam. A basic knowledge of the instrument is therefore recommended:
- When cleaning the NanoCuvette™, be sure to dry it well before inserting the new sample. This is to prevent remaining water droplets from diluting the sample more than it already is. To dry NanoCuvette™ we suggest using compressed air.
- See the document “Cleaning manual” on the website for the best possible cleaning procedure.
- In this experiment, students have to analyze unknown solutions. For this reason, five different samples must be prepared prior to the experiment:
- Take five test tubes and write numbers on (May be from 1 to 5, for example)
- Fill up (randomly) four of them with approx. 5 mL of the different types of honey. Fill the remaining glass / tube with 5 mL of 80% honey-water solution (4 mL of honey and 1 mL of DI water). Note: the honey selected for this dilution can be either honey # 1 or honey # 2 from the dilution series experiment. In this way, students can adjust the result in the calibration curve and predict its concentration.
- If several groups work in the laboratory at the same time, we suggest making different diluted solutions so that each group gets different results.
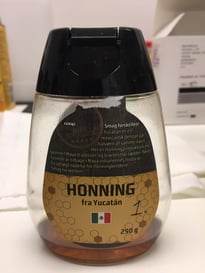
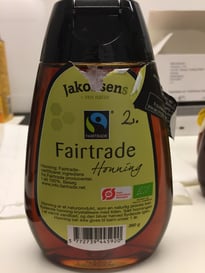
Figure 1 Honey number 1 (left), honey number 2 (Right).
Answers to data analysis questions
- The answers to the questions depend on which honey has been diluted. But with a concentration of honey in water of 80%, one can expect the water content to be in the range of 25% to 30%.
- Can you identify the diluted sample by looking at the refractive index values?
- Based on the experiment where the refractive index calibration curve was found using dilution series (see data analysis), can you predict the concentration as a percentage of the unknown sample?
- Use the following Wedmor equation: w (%) = -0.2681 - log(RI - 1)/0.002243, where w is the water content and RI is the refractive index obtained, to calculate the water content of the diluted sample. Explain in words how this can affect the product if it is sold in the market. The value is calculated as a percentage (%).
Contact
Copenhagen Nanosystems ApS,
Hørmarken 2, DK-3520 Farum, Denmark
Tel: +45 36 99 27 46
www.nanocuvette.com